- Scope and goal – location and legal context
- What is a balcony power plant
- Rules in a nutshell – what is allowed in Germany
- Our balcony power plant experiences and measurements
- Yields 2024 – per system and month
- Yields 2025 – up to and including September
- Orientation and tilt – impact on yield
- How much can you save with a balcony power plant
- Payback – what is realistic
- Which consumers work well as a PV sink
- Practice, automation and tips
- Useful tools and websites
- Pros and cons at a glance
- Checklist before buying
- Conclusion
Scope and goal – location and legal context
This article summarizes our balcony power plant experiences from two households in Hesse, Germany. You will learn what a balcony power plant is, which rules currently apply in Germany, how yield, costs and payback relate to each other, how orientation and season influence output and which consumers are a good PV sink. I also include tables with real monthly yields from 2024 and 2025, simple payback calculations and a curated list of useful tools and websites. Legal notes and numbers refer to Germany – Hesse as of 2025.
What is a balcony power plant
A balcony power plant is a small PV system with one or two modules and a microinverter that feeds into the home grid via a plug. The produced energy is consumed immediately in the household, only surplus goes to the public grid. The higher your self-consumption, the higher your savings.
Key terms
- Wp – short for watt peak, the maximum power a module can deliver under ideal conditions
- W – instantaneous power
- kWh – energy and the basis for electricity costs
- Self-consumption ratio – share of generated kWh you use yourself
Rules in a nutshell – what is allowed in Germany
Status 2025, simplified for Germany – Hesse
- Maximum feed-in to the home grid: 800 W inverter power
- Module power: up to 2,000 Wp is allowed, the inverter still limits to 800 W
- Registration: Marktstammdatenregister is required
- Rental properties: inform the landlord or the homeowners association
- Plug: Schuko is common practice, depending on the situation a dedicated feed-in connector can make sense
Always check local requirements and verify the current legal situation before purchase.
Our balcony power plant experiences and measurements
We have been running one balcony power plant per household for about 2.5 years. Both systems are mounted on a garage roof facing south with no relevant shading. On sunny days we see peaks of 700–800 W between roughly 12 and 3 pm. Self-consumption is very high. In about 1.5 years the two meters together exported only around 32 kWh to the grid.
Yields 2024 – per system and month
Reference price in the tables: 0.35 €/kWh.
| Month | Solar 01 (kWh) | Solar 02 (kWh) | Total (kWh) | Savings € at 0.35 |
|---|---|---|---|---|
| Jan | 6.27 | 7.25 | 13.52 | 4.73 |
| Feb | 18.08 | 21.55 | 39.63 | 13.87 |
| Mar | 52.98 | 56.52 | 109.50 | 38.32 |
| Apr | 77.69 | 78.40 | 156.09 | 54.63 |
| May | 100.86 | 98.62 | 199.48 | 69.82 |
| Jun | 105.78 | 102.57 | 208.35 | 72.92 |
| Jul | 111.51 | 112.06 | 223.57 | 78.25 |
| Aug | 112.17 | 112.64 | 224.81 | 78.68 |
| Sep | 74.27 | 75.61 | 149.88 | 52.46 |
| Oct | 28.05 | 33.14 | 61.19 | 21.42 |
| Nov | 9.63 | 10.77 | 20.40 | 7.14 |
| Dec | 6.69 | 7.12 | 13.81 | 4.83 |
| Total 2024 | 1,420.23 | 497.08 |
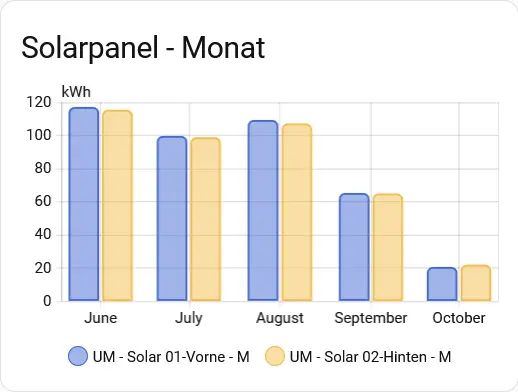
Yields 2025 – up to and including September
| Month | Solar 01 (kWh) | Solar 02 (kWh) | Total (kWh) | Savings € at 0.35 |
|---|---|---|---|---|
| Jan | 8.08 | 9.54 | 17.62 | 6.17 |
| Feb | 18.11 | 22.81 | 40.92 | 14.32 |
| Mar | 79.99 | 86.40 | 166.39 | 58.24 |
| Apr | 108.53 | 106.39 | 214.92 | 75.22 |
| May | 119.71 | 118.19 | 237.90 | 83.26 |
| Jun | 119.60 | 120.00 | 239.60 | 83.86 |
| Jul | 101.53 | 101.14 | 202.67 | 70.93 |
| Aug | 101.56 | 99.60 | 201.16 | 70.41 |
| Sep | 65.19 | 64.97 | 130.16 | 45.56 |
| Total Jan–Sep 2025 | 1,451.34 | 507.97 |
Interpretation summer vs winter
Summer months typically deliver 100–120 kWh per system. In winter we often see only 1–20 kWh per month. Spring and autumn are very efficient because modules run cooler while the sun is already high enough.
Orientation and tilt – impact on yield
| Orientation – tilt | Relative annual yield vs south | Comment |
|---|---|---|
| South, 25–35° | 100% | Standard, very good summer and solid winter |
| South-east – south-west, 25–35° | 90–98% | slightly lower yield, but a longer usable day |
| East-west, 10–20° | 85–95% | broad power window in the morning and afternoon, often higher self-consumption |
| Flat 0–10° | 85–95% | very strong in summer, weak in winter |
| Steep 45–60° | 90–95% | weaker in summer, better in winter |
| Shading | varies | avoid partial shading where possible, it can reduce string power markedly |
How much can you save with a balcony power plant
Savings = yield × self-consumption ratio × electricity price. Example for 700 kWh annual yield per system
| Self-consumption ratio | Savings at 0.35 €/kWh |
|---|---|
| 50% | 122.50 € |
| 80% | 196.00 € |
| 90% | 220.50 € |
| 95% | 232.75 € |
In our real-world setup at 0.35 €/kWh that works out to about 250 € per household per year.
Payback – what is realistic
Typical prices for an 800 W set including mounting are 500–900 €. Payback depends directly on your annual savings.
| Annual savings → | 500 € purchase | 700 € purchase | 900 € purchase |
|---|---|---|---|
| 150 € | 3.33 years | 4.67 years | 6.00 years |
| 200 € | 2.50 years | 3.50 years | 4.50 years |
| 230 € | 2.17 years | 3.04 years | 3.91 years |
| 250 € | 2.00 years | 2.80 years | 3.60 years |
| 300 € | 1.67 years | 2.33 years | 3.00 years |
With good orientation, a high self-consumption ratio and possible local incentives, 2–4 years are realistic in Germany.
Which consumers work well as a PV sink
Important distinction: watt is power, kWh is energy. Daily kWh determine your bill.
| Device – consumer | Typical power or energy | Example daily energy | Suitability |
|---|---|---|---|
| Chest freezer | regulated | 0.25–0.35 kWh | very good as a continuous load |
| Homelab – server | 50–80 W | 1.2–1.9 kWh | very good continuous load |
| 4K monitor | 30–50 W | 0.15–0.25 kWh for 5 h | good, use during PV hours |
| Mini PC | 40–60 W | 0.3–0.5 kWh for 6–8 h | good, daytime use |
| Aquarium pump | 20 W | 0.48 kWh | very good continuous load |
| 50″ TV | about 100–200 W | 0.4–0.8 kWh for 4 h | good when used in the afternoon |
| Gaming PC | 80–300 W | 0.3–1.2 kWh depending on use | good when gaming in the afternoon |
| Old refrigerator | regulated | 0.7–1.2 kWh | good – check seals and temperature |
Practice, automation and tips
- Shift loads: run dishwasher, washing machine and dryer during the day
- Bundle base load: router, NAS, server, chargers and displays should run in the solar window
- Use smart plugs and Home Assistant to switch on consumers when PV surplus is available
- Ensure good module ventilation, tidy cable routing, windproof mounting and RCD protection
- If you often leave potential unused, add more module area up to 2,000 Wp on the same 800 W inverter
Useful tools and websites
| Tool – website | Purpose | Link | Field notes |
|---|---|---|---|
| Solar Forecast for Home Assistant | forecast inside your smart home | https://www.home-assistant.io/integrations/forecast_solar/ | good direction, my real values are often higher – ideal to trigger automations |
| Solar Kataster Hessen | potential of your roof or garage | https://www.lea-hessen.de/buergerinnen-und-buerger/sonnenenergie-nutzen/solar-kataster-hessen/ | draw areas, plan modules, rough yield estimate |
| Sonnenverlaufskarte | sun path and shading | https://www.sonnenverlauf.de | quick check for daily and seasonal shading |
| PVGIS | detailed EU yield simulation | https://ec.europa.eu/jrc/pvgis | solid benchmark for expectations |
| Global Solar Atlas | global irradiation data | https://globalsolaratlas.info | quick potential check |
| Marktstammdatenregister | mandatory registration in Germany | https://www.marktstammdatenregister.de | do not forget to register |
| Solcast | high quality PV forecasts | https://solcast.com | can be integrated with Home Assistant |
| PVOutput | community comparison of yields | https://pvoutput.org | external benchmarks and charts |
| Home Assistant Energy Dashboard | visualize generation and consumption | https://www.home-assistant.io/energy/ | great for self-consumption ratio and history |
| SMARD | German power market data | https://www.smard.de | background and context such as prices and mix |
| HTW Berlin storage reports | neutral storage comparisons | https://pvspeicher.htw-berlin.de | helpful if you plan a battery later |
Pros and cons at a glance
| Pros | Cons |
|---|---|
| noticeably lower electricity bill | strong seasonality – winter is weak |
| simple installation and operation | orientation and statics can limit options |
| high self-consumption ratio possible | agreements needed in rental properties |
| works great with smart home automation | 800 W cap limits feed-in peaks |
Checklist before buying
| Topic | Questions for you |
|---|---|
| Location | south orientation possible, low shading, secure mounting |
| Load profile | which continuous loads do you have, which loads can you shift |
| Set | 800 W inverter, module area up to 2,000 Wp, suitable mounting |
| Meter | modern meter installed, replace Ferraris if needed |
| Registration | register in the Marktstammdatenregister |
| Safety | fixed mounting, tidy cables, RCD protection, ventilation behind modules |
Conclusion
Our balcony power plant experiences in Hesse, Germany show the following. With good orientation and smart load shifting, yield, costs and payback are very attractive. Per system we realistically reach 700–750 kWh per year. At 0.35 €/kWh this saves roughly 250 € per household per year. Depending on purchase price the payback is usually 2–4 years. If you have a daytime base load and consciously use the produced energy, a balcony power plant almost always pays off. The rules in Germany are straightforward – the important points are the 800 W feed-in limit, registration in the Marktstammdatenregister and safe mounting. With the tools listed above you can plan, monitor and optimize your setup effectively.